The Dashboard Looked Fine. The Decision Was Not.
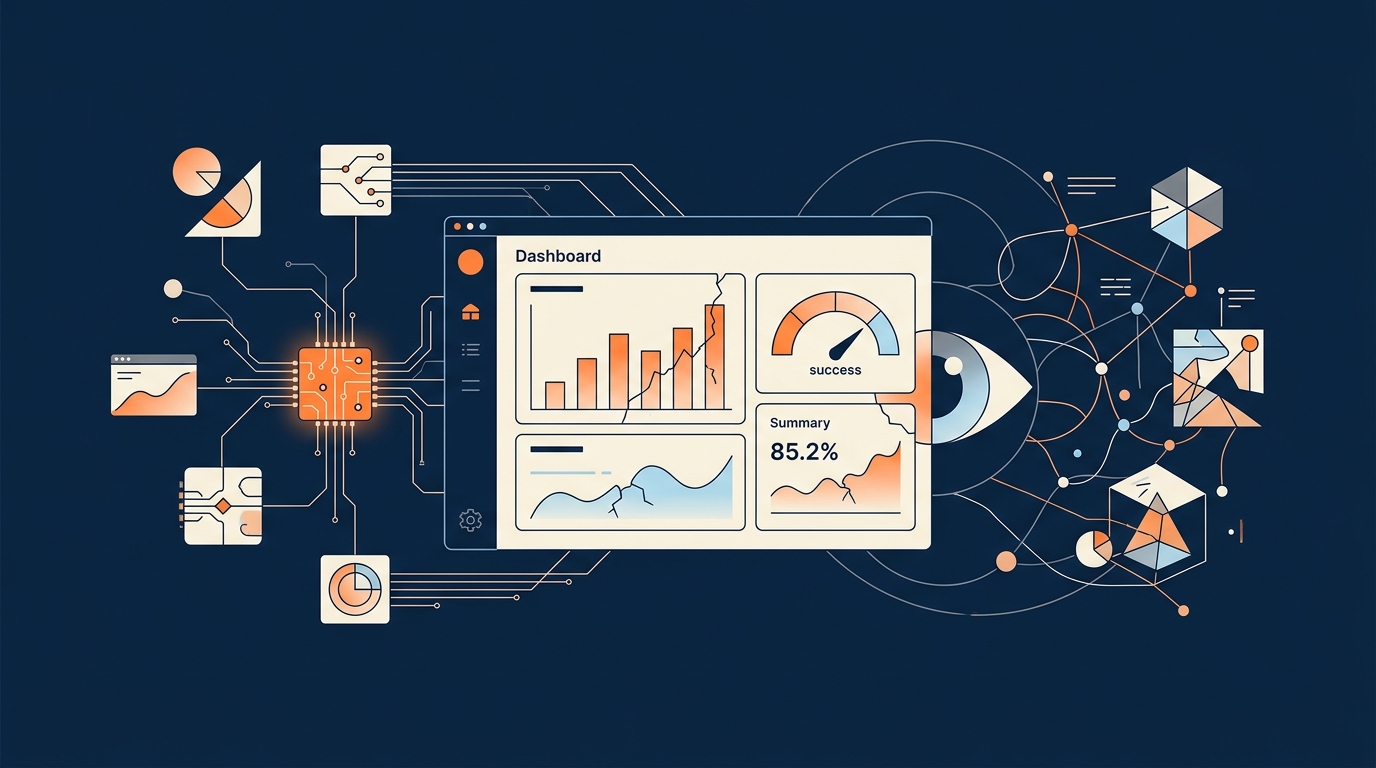
Here's a scenario that's going to play out in a lot of small businesses this year. Someone pulls up the dashboard before a planning meeting. Revenue looks solid. Churn looks flat. Everyone nods, decisions get made, budgets get allocated. Three weeks later someone realizes a field got renamed during a SaaS update, half the churn data has been missing since then, and the "flat" churn number was actually a hole in the pipeline. Nobody lied. Nobody was careless. The dashboard just kept rendering because dashboards are built to render, not to tell you when the data feeding them is broken. That's the real problem for 2026. Speed of refresh is not the same thing as reliability. A chart can update in real time and still be feeding you garbage. The most common reasons dashboards go bad aren't dramatic outages, they're quiet ones: a KPI definition that changed in one department but not another, a process tweak that never made it into the reporting logic, a field that got retyped somewhere upstream. The chart isn't wrong. The business definition underneath it is.
Why Small Data Stacks Break Easier, Not Harder
You'd think a smaller data stack would be more stable. It's usually the opposite. SMBs run lean, which means fewer redundancies and fewer people watching for structural changes. One SaaS app pushes an update. One field gets renamed from "customer_id" to "cust_id." One ETL job chokes on a data type it wasn't expecting. Nobody notices until the numbers stop making sense, and by then the bad data has already worked its way into revenue reporting, retention dashboards, inventory planning, or ad spend decisions. This is what schema drift detection is built for. It compares incoming data against a stored baseline, run after run, and flags when columns get added, removed, renamed, or retyped. Then it classifies the change: handle it automatically, quarantine it, or send it to a human. That last option matters more than it sounds like it should. You don't need every anomaly to trigger a fire drill. You need the system to know the difference between a harmless field addition and a change that's about to corrupt your churn number.
Quarantine, Not Collapse
The smarter data tools have moved past simple alerting. Instead of letting a pipeline fail outright when it hits something unexpected, they check schema consistency at ingestion, monitor null rates and distributions, and quarantine anything that doesn't match the expected structure. The pipeline keeps running. The bad data gets set aside instead of blended into your reporting. Nothing collapses, and you get time to actually look at what happened instead of scrambling to rebuild a broken feed at 9pm. For a business without a data engineering team, that difference is the whole game. You're not trying to prevent every possible issue. You're trying to make sure issues don't silently poison the numbers you're using to make real calls about cash, staffing, and inventory.
Where AI Actually Earns Its Keep
AI doesn't replace judgment here, it removes the grunt work around it. It infers likely validation rules from your historical data instead of making someone write hundreds of static thresholds by hand. It adapts when your schemas evolve, which happens constantly with SaaS integrations, ecommerce feeds, and third-party APIs that change on their own schedule, not yours. And it prioritizes alerts by business impact, so you're not getting pinged about a rounding difference in a table nobody looks at while a real problem in your revenue pipeline sits unnoticed. That prioritization piece is underrated. Alert fatigue kills monitoring programs faster than bad data does. If everything is urgent, nothing is, and eventually people just stop checking.
Protect the Few Metrics That Actually Run the Business
You don't need to govern every table with equal intensity. You need to identify the handful of metrics that actually drive decisions, usually revenue, pipeline, churn, fulfillment, and cost, and treat those as must not drift. Assign an owner to each one. Document what it actually means. Monitor the source system feeding it and know how much lag is normal versus a red flag. That's the practical version of data governance for a business without a governance team. Not a massive framework, just tight control over the few numbers that move real money.
Fewer Surprises, More Trust
Going into 2026, the businesses with an advantage aren't the ones with the biggest data teams. They're the ones who stopped assuming a fast-loading dashboard means an accurate one. Catching a broken field before it reaches a board deck isn't glamorous work, but it's the difference between a decision based on reality and one based on pipeline noise. You don't need enterprise headcount to get enterprise-grade trust in your numbers. You need the right checks running quietly in the background, watching the metrics that actually matter, so you can stop wondering if the dashboard is telling you the truth.
Free, about two minutes
How much of your busywork could actually be automated?
Answer eight quick questions and get a personalized PDF: your automation score, your top three opportunities, and what they are worth in hours and dollars. No sales call required.
Get your AI Score